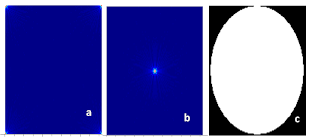
A .Familiarization with FT of different 2D patterns

Figure 1. a FFT of a circle, b. shifted FFT and c. FFT of FT resulting to the same circle.
Figure 2.
For Fig.2, the images above starting from the left are namely, an annulus, a square, square annulus, 2 slits and 2 dots all representing what we call apertures. The images on the bottom are their corresponding FT which is an Airy pattern for the annulus, a sinc function for the square apertures, double slit diffraction of maxima and minima in the horizontal axis for the vertical slits ans the sinusoid for the two dots.
a. b. c. d.
Figure 3. Comparison of a circular annulus and square annulus.
As expected the we have the a Airy pattern for a,b and a sinc function for c,d.
From these results we can say that the size of the aperture determines the intensity of the resulting diffraction pattern. It can be seen that the smaller the aperture is the brighter or more intense the FT or diffraction pattern is.
Figure 4. Variation in the dot size or pinhole radii
IT is shown in Fig.3 that the FT of 2 dots is a superposition of the FT of 2 small dots and FT of a circular aperture.
B Anamorphic property of the Fourier Transform
Anamorphic means something like producing different imaging effects along mutually perpendicular radii. We can see these in FT of perpendicular sinusoid signals.

Figure 5. Increase in the frquency
Increasing the frequency of the signal(sinusoid) resulted to the increase in the separation of the dots. We see here that the two dots corresponding to the frquency peaks shifted farther and father from the center, such that the lower the frequency the closer it is to the center while farther at higher frequency. The same with interferograms ,the spacing between the peaks of the FT of the signal gives corresponding frequency of the signal.

Fig.6 Effect of biasing

For a sinusoid of constant frequency and orientation, we expect that the peaks of the FT to remain the same since and it did and the position of the peaks did not vary. However the intensity of the dots was observe to change such that at low biasing the outer peaks were brighter and reduced at higher biasing which made (m=0) the central maximum peak brightest.

Fig.7
Since adding or subtracting the bias didn’t affect position of the peaks of the FT of the signal , we can just to choose to add the bias . For frequency=4, bias=0.1,1,10,100 was added to the sine wave and the resulting FT of the signal show that the only the intensity of the peaks varied and not the spacing.
 Fig. 8
Rotating the signal(sinusoid) by an angle results to the rotation of the peaks of the FT.

Fig. 9
Top image shows the pattern and below is its Fourier transform .Now the combination of these sinusoids in X and Y with the formula
z = sin(2*%pi*4*X).*sin(2*%pi*4*Y);
has a FT that is again symmetric about the center and with peaks that correspond to the frequency of each sinusoid in their respective axis. The combined signal had the same frequency as illustrated in their perfect symmetry but once we changed one of the frequency of the signals, say in the X axis,
z4 = sin(2*%pi*8*X).*sin(2*%pi*4*Y);
the x separation in the vertical orientation increased. We recall that the higher the frequency the farther the peak from the center.
 Fig 10
Addition of the combined sinusoids in the X and Y axis to 2 rotated sinusoids (theta=40,60deg) resulted to the image illustrated on top. Below is its FT which by inspection, is just the sum of the FT of each signal. The FT is thus useful for decomposing the frequency component in sampled signals.
++++++++++++++++++++++++++++++++++++++++++++++++++++++++++


 Figure 5.
 Figure 6.
 before(original fingerprint)
 after-the enhanced fingerprint with ridges more clear and less blotches. This final image is from Figure 6c.


